TrendSpider
Why TrendSpider is the Ultimate Choice for Traders Seeking an Edge in the Markets
TrendSpider stands out as one of the most advanced and automated technical analysis platforms available today, trusted by thousands of retail and professional traders who want to eliminate manual chart work and uncover high-probability setups faster. Launched in 2016, TrendSpider combines artificial intelligence, machine learning, and visual backtesting to automatically draw trendlines, support/resistance levels, Fibonacci retracements, chart patterns, candlestick patterns, and more—updating them in real time as price moves. Unlike traditional charting tools like TradingView (which require manual drawing and constant babysitting), TrendSpider does the heavy lifting for you, helping traders spot opportunities across stocks, forex, crypto, futures, and ETFs without missing a beat.
What truly sets TrendSpider apart is its focus on automation and multi-timeframe confluence: it analyzes multiple timeframes simultaneously, detects dynamic levels that adapt to price action, and lets you backtest strategies visually with no coding required. Add to that Raindrop Charts (a volume-based alternative to traditional volume bars), automated alerts on confluences, smart watchlists, heatmaps, and direct broker integrations (Interactive Brokers, TradeStation, Alpaca, Tradier, and more), and you have a complete trading workstation in one place. Plans start at $39/month (Essential), with Professional ($79/month) and Elite ($129/month) unlocking more features, but even the base plan includes unlimited charts, alerts, and backtesting—making it one of the best values in technical analysis software.
For traders new to advanced charting, TrendSpider’s intuitive interface and guided onboarding make it surprisingly approachable—start with automated trendlines and alerts, then layer in backtesting and scanners as you gain confidence. The platform’s strong community, education library, and responsive support team help users level up quickly. Below, I’ve reviewed four standout features based on popularity, innovation, and real trader impact. Available directly from trendspider.com with a 7-day free trial (no card required), these features showcase why TrendSpider is the go-to platform for serious traders who want to see what others miss.
TrendSpider Automated Trendlines & Dynamic Levels: The Foundation for Smarter Charting
TrendSpider’s Automated Trendlines & Dynamic Levels are the platform’s signature feature, automatically detecting and drawing trendlines, channels, support/resistance zones, Fibonacci retracements, and more—updating in real time as price evolves, included in all plans (starting at $39/month). Unlike manual drawing on TradingView, TrendSpider uses proprietary algorithms to identify meaningful levels based on actual price action, reducing noise and highlighting high-probability zones.
For beginners, it’s a revelation: load any chart, and watch clean, accurate trendlines appear instantly—no guesswork or constant redrawing. You can customize sensitivity, timeframe weighting, and even anchor points, while multi-timeframe analysis shows confluence across daily, hourly, and 5-minute charts simultaneously.
Traders consistently call this “the killer feature,” with reviews noting it saves hours per week and catches levels they would have missed. Many report higher win rates simply by trading off automated zones. For anyone tired of manual charting, TrendSpider Automated Trendlines & Dynamic Levels are a must-have that instantly upgrades your technical game.
TrendSpider Raindrop Charts: The Volume-Weighted View That Reveals True Market Intent
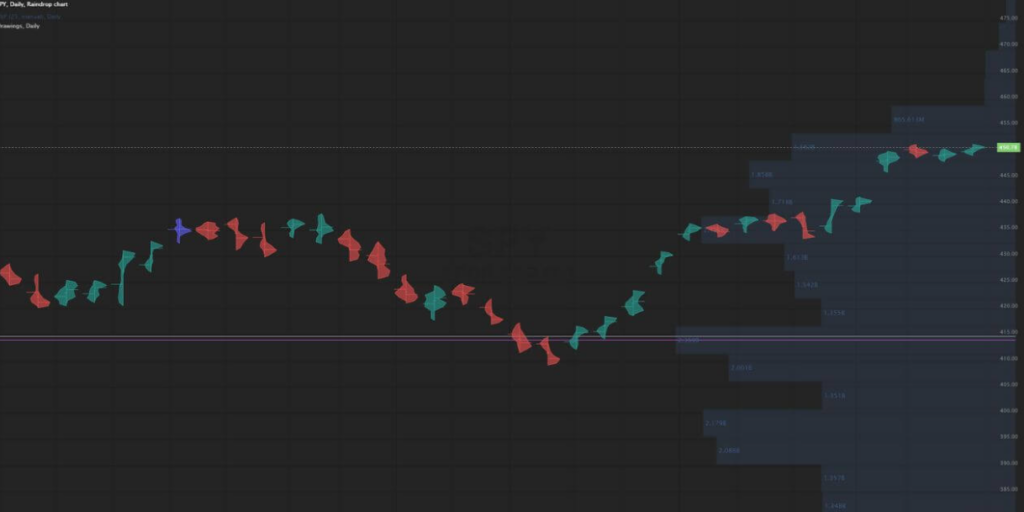
TrendSpider Raindrop Charts are a proprietary volume-based chart type that replaces traditional candlesticks with volume-weighted “raindrops,” showing where the majority of volume occurred within each period—available on all plans. Unlike regular volume bars, Raindrops highlight value areas, fair value gaps, and sentiment shifts, making it easier to spot institutional buying/selling pressure and hidden support/resistance.
New users quickly see the difference: switch to Raindrops on any timeframe, and suddenly volume tells a clearer story—blue/red coloring shows buyer/seller dominance, and the “body” of the raindrop reveals where real money flowed. It’s especially powerful on lower timeframes for scalping or intraday trading.
Feedback from active traders calls Raindrops “eye-opening” for understanding market structure, with many switching permanently after seeing how they expose fakeouts and real breakouts. For volume-focused traders, TrendSpider Raindrop Charts are an essential edge that gives you insight most platforms simply can’t match.
TrendSpider Strategy Tester (No-Code Backtesting): The Visual Strategy Builder for Confident Trading
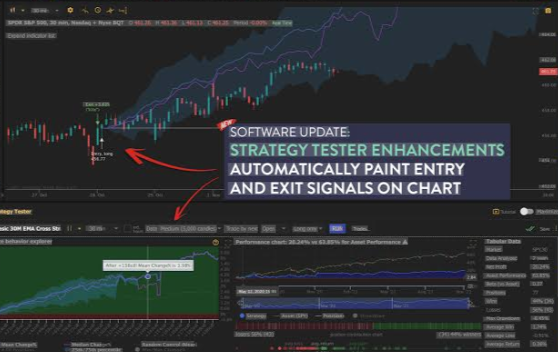
TrendSpider Strategy Tester allows you to build, backtest, and optimize trading strategies visually—no coding required—using a drag-and-drop interface, included in Professional and Elite plans ($79–$129/month). Define entry/exit conditions, stops, targets, and indicators, then run historical tests across any timeframe or symbol, with detailed performance metrics, equity curves, and trade-by-trade breakdowns.
For beginners, it’s empowering: start with simple rules like “price above 50 EMA + RSI > 50,” test on past data, and see win rate, profit factor, and drawdown instantly. Tweak parameters visually and retest until you’re confident—then set automated alerts or bots to execute.
Users praise it as “the best no-code backtester,” with many reporting they finally stopped guessing and started trading proven edges. Reviews highlight the speed and clarity compared to manual Excel backtests. For traders who want data-driven decisions, TrendSpider Strategy Tester is a must-have that turns ideas into validated strategies fast.
TrendSpider Smart Alerts & Multi-Timeframe Confluence: The Alert System That Actually Works
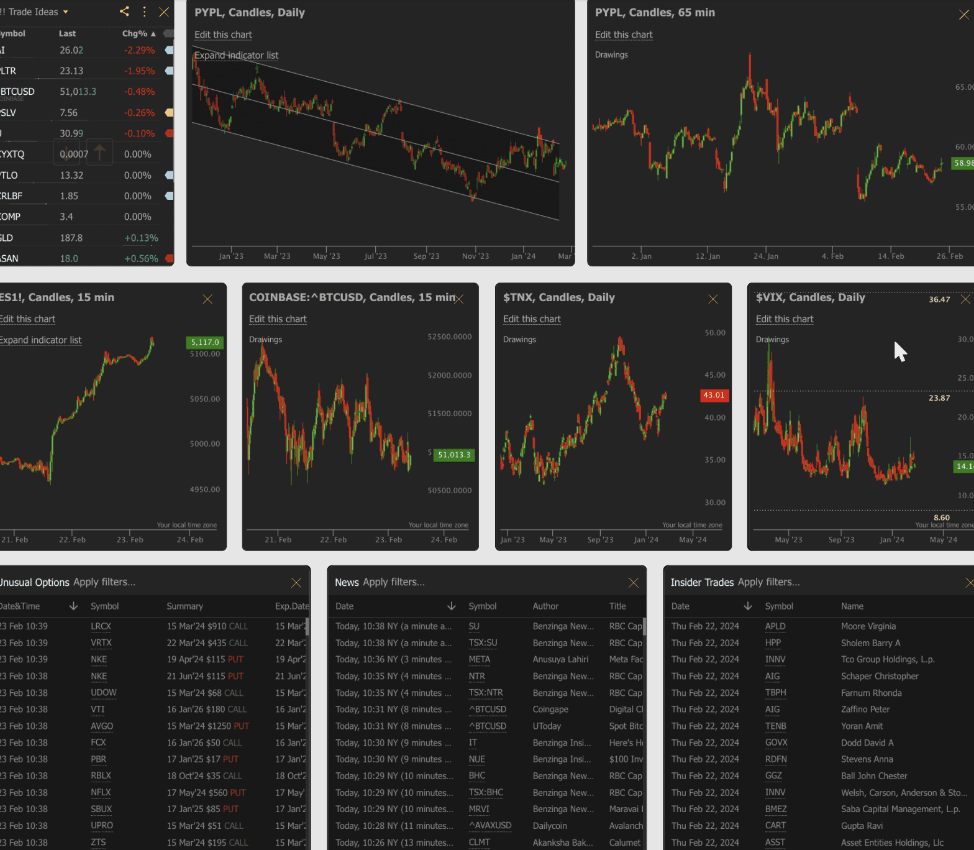
TrendSpider Smart Alerts let you set dynamic, multi-condition alerts based on price, indicators, trendlines, patterns, or confluences across timeframes—all in real time, included in all plans. Alerts can trigger on breakouts, bounces, Fibonacci hits, or custom logic (“price above auto-trendline + volume spike + RSI divergence”), with notifications via email, SMS, webhook, or in-app.
Beginners can start simple—set an alert on a breakout or support bounce—and gradually layer conditions for high-probability setups. The multi-timeframe view shows if daily support aligns with hourly trend, giving context most platforms lack. Alerts are smart enough to avoid noise and only fire on meaningful events.
Traders call the alert system “the best in the industry,” with reviews noting they catch moves while sleeping or working. Many say it’s worth the price alone for never missing key levels. For traders who want to be notified only when it matters, TrendSpider Smart Alerts & Multi-Timeframe Confluence are an essential edge that keeps you ahead of the market.
TrendSpider isn’t just charting software—it’s a trading advantage engine, fueling better decisions with automation, intelligence, and clarity backed by thousands of successful users. These four standout features—Automated Trendlines & Dynamic Levels, Raindrop Charts, Strategy Tester, and Smart Alerts & Multi-Timeframe Confluence—capture TrendSpider’s excellence, delivering transformative results for beginners and pros alike. Head to trendspider.com today, start your 7-day free trial (no card needed), and see the markets like never before. Your next high-probability trade awaits—make TrendSpider your unfair advantage.